Demography and Human Resources: Unforgiving Constraints for a Russia in Decline
Demography and Human Resources: Unforgiving Constraints for a Russia in Decline
The famous aphorism attributed to the 19th century French polymath and socialist Auguste Comte is that “demography is destiny.” Perhaps so—but only over a sweep of history so grand, so vast and so distant from human beings themselves that human agency is no longer visible. When it comes to the foreseeable demographic future—which for all intents and purposes amounts to a generation or less—a rather different aphorism would be more pertinent: here we would be better served to suggest that “demographics slowly but unforgivingly alters the realm of the possible.”
Note the important distinctions between these two formulations: they center on the role of human beings in world events. Over the course of a generation (rather than a millennium), demographic change typically presents a society with both risks and opportunities—potentialities to which peoples, economies and national directorates can respond, and those responses can reduce exposure to risk and enhance the odds of capitalizing on opportunities. Demographic change, in other words, is more than a story of materialistic determinism.
But demography also establishes certain material realities: “facts on the ground” that are impossible to ignore. These demographic realities tend to be stubborn and—for ambitious governments or political movements—often distinctly inconvenient. They tend to change only slowly (barring catastrophic events). And given the intrinsic biological regularity of unfolding demographic developments, it is possible to compose a relatively accurate picture of a large country’s demographic profile a decade or even two decades in advance. The inherent predictability of demographic profiles so far into the future, furthermore, also means that important demographic parameters—including those arguably bearing on national power or social vulnerabilities—are in effect more or less “fixed”: and not only for today, but for many years to come.
This basic background may help us put demographic prospects for today’s Russian Federation into a better, more considered, perspective. For in a variety of meaningful respects, Russia’s demographic current trends and future outlook may be described as decidedly unfavorable—not only unfavorable for social wellbeing, but also unfavorable for augmentation and international application of power.
We need to bear in mind the differences between these two yardsticks. It is possible for demographic trends to conduce toward an improvement in human wellbeing under a state whose demographic trends are at the same time limiting or even constricting potential for global influence—and vice versa. In Russia today, however, a range of demographic indicators relating to both human wellbeing and state power are characterized by negative—or even extremely negative—tendencies. By the sorts of criteria often used to measure it, human wellbeing in the Russian Federation is on track to lag ever further behind in the general pool of humanity, as it has been doing for over half a century. And taking the Russian state’s current structure and international ambitions and project them on into the future, we can see that the demographic foundations for its exercise of power politics promise to be compromised progressively and perhaps, in due time, critically.
Current Demographic Trends in the Russian Federation
The overall demographic situation in Russia today will be familiar to most general readers, to say nothing of specialists in Russian affairs or international relations. But a thumbnail summary and update may be useful here, not least to set the stage for some of the developments we may anticipate in the years immediately ahead.
As is well known by now, Russia suffered a sharp bout of depopulation in the period immediately following the collapse of the Soviet state. (see Figure 1)
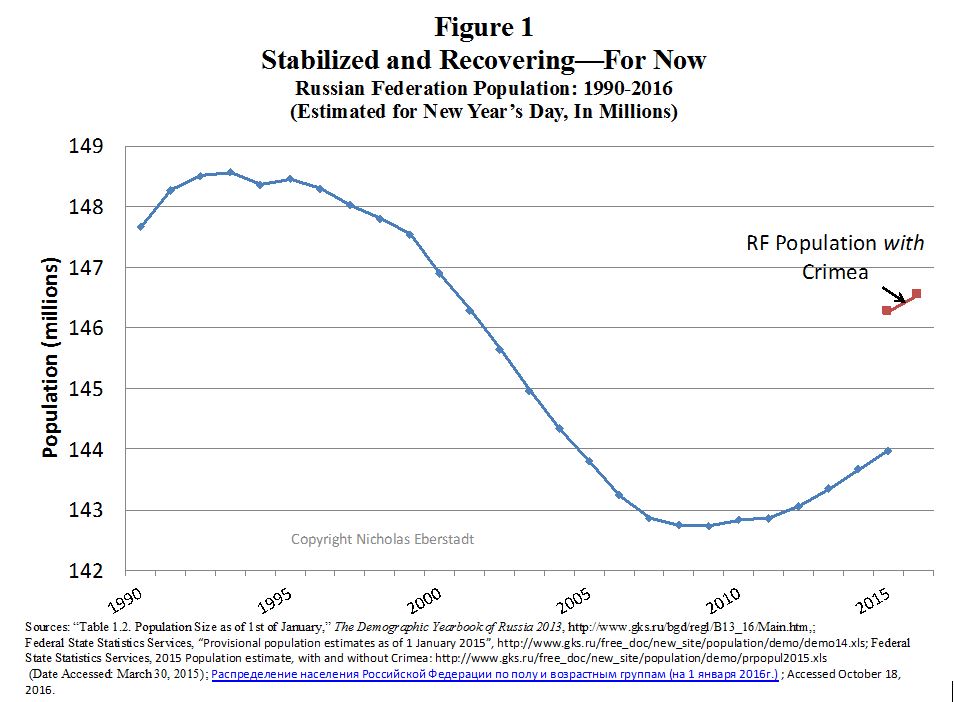
According to official figures from the Russian Federation Statistical Service (also today known as Goskomstat, as it was in the Soviet era), Russia’s population peaked in the year 1993 at a bit less than 149 million—after which it began a downward slide. In 2008/09, when the estimated population was a bit under 143 million, the slump stabilized; then, between 2008 and 2015, the officially estimated population within the state’s 1991 boundaries increased by a bit more than one million. The Population jumped by an additional two-plus million in 2015 thanks to the invasion and annexation of Crimea (to date, seizing foreign territory has proved to be the Putin Kremlin’s most successful policy for increasing the national population). Nevertheless, while the Russian Federation’s population is still reportedly increasing at this writing, total Russian Federation numbers at the beginning of 2016 were officially about three million fewer than on New Year’s Day in 1993, roughly a generation earlier.
Note that population decline per se need not presage a decline in living standards or human wellbeing in a contemporary society. Germany and Japan, among other places, offer “existence proof” to the contrary. Further, it would seem self-evident that Germany’s international influence has been on the wane over the past decade, i.e. since its own depopulation commenced. This may only underscore what should be obvious: namely, that the “particulars” of depopulation matter (among these, the demographic factors accounting for the reduction in human numbers, the economic arrangements in the society in question, and the political configuration of the locale under consideration). It will suffice here simply to observe that Russia’s depopulation was qualitatively quite different from the ongoing demographic declines in Germany and Japan. We may also note there is good reason to expect that Russia’s current stabilization, and slight uptick, in human numbers may prove to be temporary—as will be explained shortly.
The arithmetic of post-Soviet Russia’s depopulation deserves brief examination here. (see Figure 2)
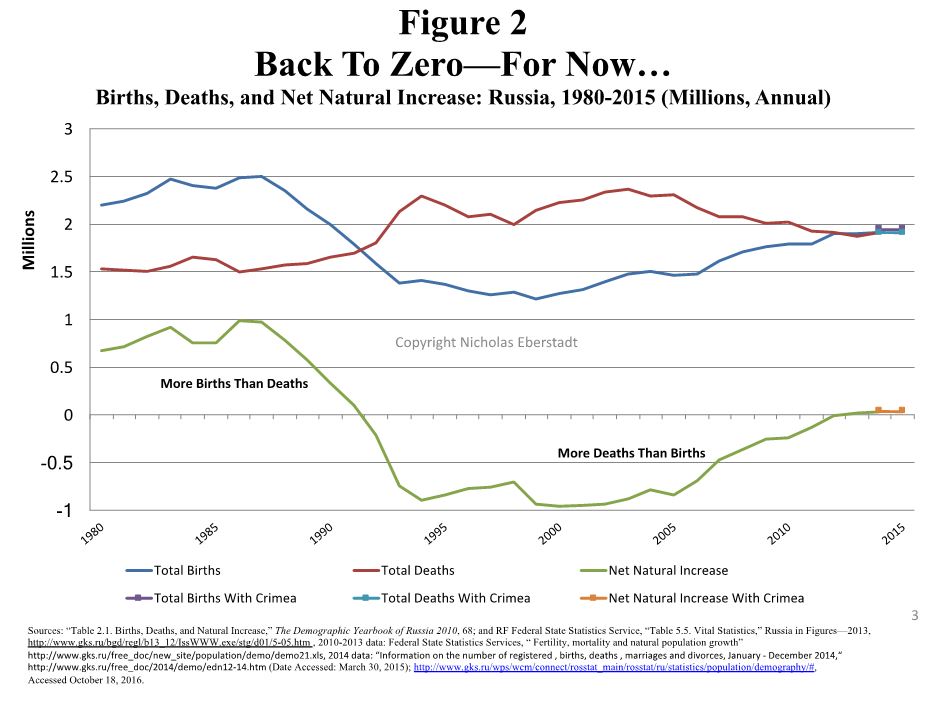
Russia’s demographic slump was caused by a collapse of births, in conjunction with a sudden upsurge in deaths. In the late Soviet era, according to Goskomstat, total annual Russian Federation (or as it was then, RSFSR) births peaked in 1987 at about 2.5 million. At that same time, annual deaths were running at about 1.5 million a year—implying a “net natural increase” of about one million annually. By 1993, annual births had fallen below 1.4 million, while annual deaths had soared to 2.1 million. Worse was seemingly yet to come. By 1999, Russia’s annual birth total had dropped to 1.2 million—less than half its level just 12 years earlier. Annual deaths, on the other hand, erratically rose somewhat further, and approached the 2.4 million figure in 2003.
This was not a smooth and gradual “demographic evolution.” It was a sudden, rough and wrenching, “demographic shock.” That shock seemingly began to abate around 2005: around that time Russia saw a simultaneous increase in births and a decrease in annual deaths. By the year 2013, births and deaths were in rough balance (actually with a slight excess of births over deaths, as Kremlin policymakers were pleased to announce). Reported births have continued slightly to exceed reported deaths for the Russian Federation over the past few years as well. But here again, as we shall see, there is reason to expect this resumption of a rough equilibrium to be only temporary in nature.
In any case, over the period 1992–2012, Russia experienced a prolonged bout of what demographers would inelegantly call “negative natural increase.” Over those years, the Russian Federation reported nearly 14 million more deaths than births—nearly three deaths for every two births. That is the sort of disproportion demographers would most usually expect to find from a society in the grip of a famine, or an epidemic, or a cataclysmic war—not from a modern urbanized literate society during peacetime. Russia was not the only country during this period to experience a sharp surfeit of deaths over births. (see Figure 3)
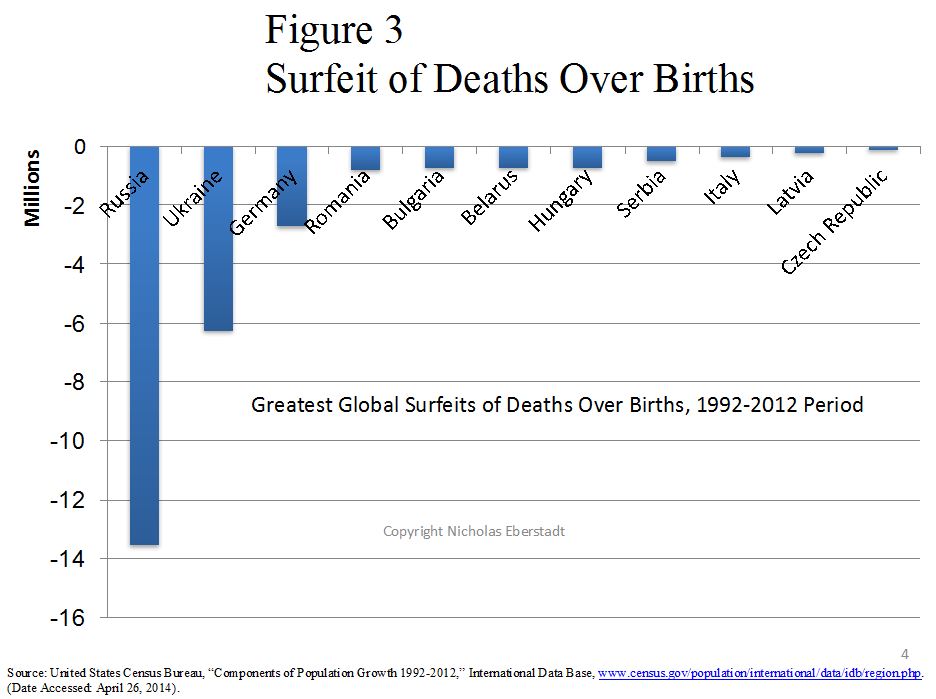
Many other post-Soviet societies did as well, as a result of their own respective post-Communist “demographic shocks.” But in absolute magnitude Russia’s was by far the largest. (Indeed, in the entire postwar era only one other society experienced an episode of “negative natural increase” of greater absolute magnitude—that society being Maoist China in the wake of the disastrous “Great Leap Forward.”) The numbers in Figure 3, furthermore, underscore that Russia’s depopulation would have been even more severe had it not been for immigration: that owing to a net inflow of people from the “near abroad” and elsewhere, Russia’s post-Communist decline in population between 1992 and 2012 was less than half as large as it would have been with no immigration at all.
Fertility and Family Formation
Everywhere and always, the drivers of national population change are births, deaths and migration: we can examine each of these factors in a little more detail at this point for the Russian Federation.
We can begin with births, focusing on these through the lenses of fertility and family formation patterns. Perhaps the most intuitively clear metric for tracking fertility is the “total fertility rate” (or TFR), which measures births per woman per lifetime. A second metric of intuitive clarity and importance is the “net reproduction rate” (or NRR), which estimates the number daughters per woman expected to survive to childbearing age themselves. In effect, the NRR offers a “replacement ratio” for each rising generation: an NRR of 1.0 presaging long-term population stability, all other things being equal, and a figure of less than 1.0 implying inter-generation cohort shrinkage, absent compensatory in-migration.
Figure 4 reports Russian Federation trends in NRR from 1980 to 2014. (see Figure 4)
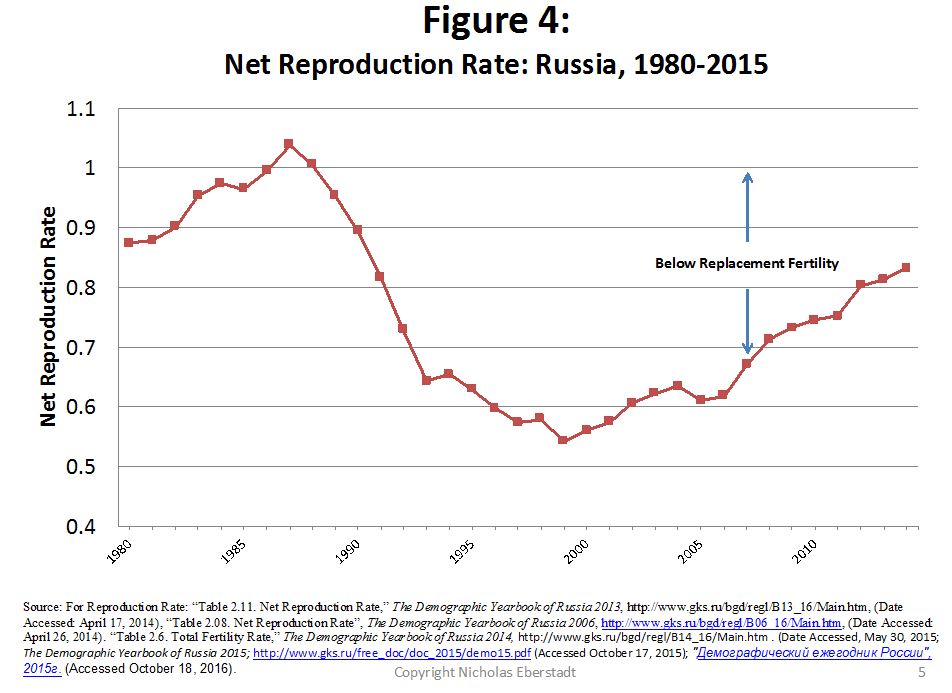
In only two of those twenty-five years (1987 and 1988) was Russia’s NRR above replacement, and then only just barely. From 1989 onward, Russia’s NRR has been below replacement—and for much of that period, it has been steeply sub-replacement. Russia’s NRR reached a peacetime nadir (at least to date) in 1999, when it fell below 0.55—a level which, if maintained, would have consigned each successive cohort to shrink by 45%. Since 1999, Russia’s NNR has almost steadily rebounded. By 2014, in fact, it was slightly higher than in 1991—which it to say, higher than at any time in the post-Soviet era. Even so, the Russian Federation’s NRR in 2014 was just 0.83; if that level held indefinitely, each new generation would be smaller (by about one sixth) than the one before it, all other things being equal. [1]
We should emphasize that there is absolutely nothing unusual about Russia’s current fertility level from a contemporary European standpoint. According to estimates by the UN Population Division, Europe as a whole has been a sub-replacement fertility zone for almost forty years (since the late 1970s)—and every sub-region of Europe has been sub-replacement since the early 1980s. [2]
Broadly speaking, Europe appears to have entered into what some demographers have termed “the second demographic transition” [3]: an environment in which marital unions are increasingly unstable; serial unions are increasingly common; births outside marriage are proportionately more frequent; and sub-replacement fertility is the expected norm. As may be seen in Figure 5, virtually every country in Europe records sub-replacement fertility nowadays, and in general countries with higher proportions of out of wedlock births tend to register higher levels of fertility. (see Figure 5)

Russia looks to be on the outer envelope of the contemporary European experience—with relatively high fertility and a relatively low proportion of extra-marital childbearing—but Russia’s patterns here are distinctly and recognizably “European” nonetheless.
As in the past, Russia today is characterized by some striking regional differences in fertility, as one might expect in a country of such ethnic and geographic diversity. (see Figure 6)
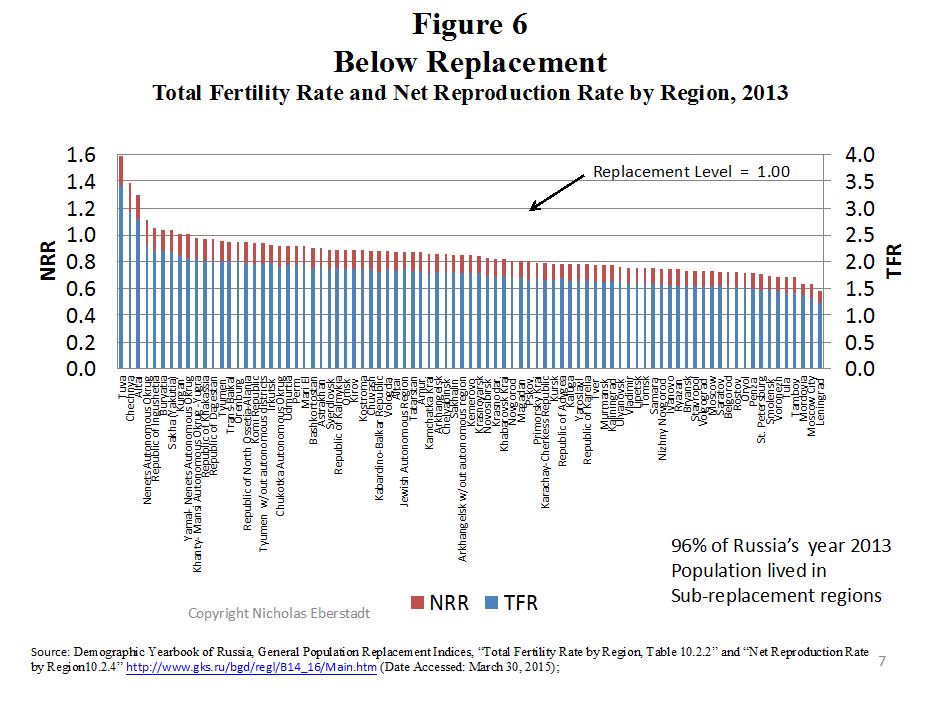
In 2013, according to Goskomstat data, the TFRs and NRRs for Russia’s most fertile oblast was about two and half times as high as for the lowest. A handful of provinces in Russia reported above replacement fertility that year—but these were areas with predominantly non-Russian ethnic populations, and in any event accounted for only about 4% of the country’s total population. Note that NRRs for affluent and elite St. Petersburg and Moscow were among the nation’s very lowest—respectively 30% and 37% below the replacement level.
Differential fertility implicitly amounts to a process of re-peopling: and if the differentials are sufficiently large, and maintained over a sufficiently long period of time, the re-casting of subgroups within a society or a nation can be consequential. It may be noteworthy that the lowest NRRs in Russia for the most part represent provinces from the country’s original historic heartland—places overwhelmingly “Russian” in ethnicity—while the places with the highest NRRs tend to be locales with historically Islamic cultural ties, or places with concentrations of indigenous non-Russian peoples. How much do such demographic differentials matter? In no small part, the answer to that question depends upon assimilation: on the degree to which the ethnic minorities in question can be incorporated as loyal and productive members of the greater society. (One of the concepts in play here is what sociologists awkwardly term “ethnic self-re-identification”—but of course there is much more at stake here as well.) Just how well this is occurring in Russia today, and in the years ahead, is an issue to be debated by others better informed than this author.
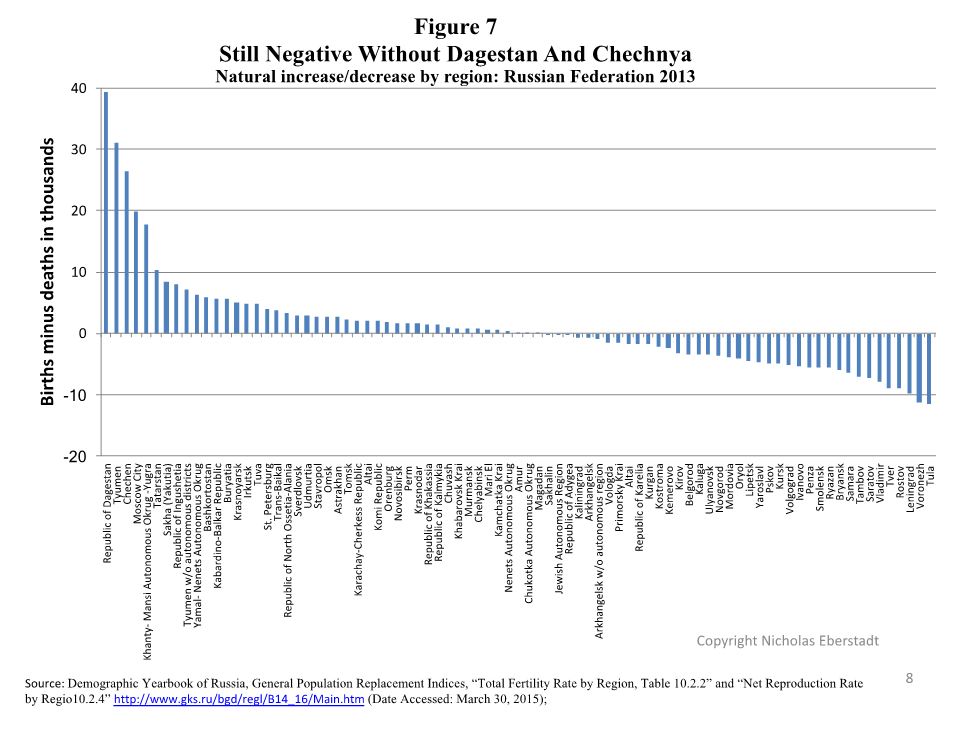
Differential fertility has consequences for regional growth—and also regional decline—within Russia. A regional look at “natural increase” patterns affirms this. Although births and deaths were in rough balance for the Russian Federation as a whole as of 2013, there were nonetheless areas with big net gains, and big net losses, at the oblast level. (see Figure 6) Roughly half of Russia’s provinces still reported more deaths than births that year—and the “net mortality” provinces were disproportionately representative of persons of Russian ethnicity. Conversely, the “net natality” provinces tended to be ones in which Russian ethnics were under-represented. Note that Goskomstat reported that Dagestan and Chechnya together accounted for a combined surfeit of births over deaths of about 65,000 in Russia in 2013. That same year, Russia’s overall natural increase was reported to total just over 30,000. If we excluded these two provinces of historically “Muslim” cultural affinity, Russia would still be reporting slight “negative natural increase”—and if we were to subtract other similar provinces (Tatarstan, Ingushetia, etc.) the negative balance for the rest of Russia would be all the greater.
Migration, Both International and Domestic
Consider next the movement of the population in and out of Russia, and within Russia from one region to another. For a variety of reasons, migration statistics tend to be more problematic and less reliable than birth or death numbers. With that proviso, we can inspect the official and unofficial estimates for population flows within Russia and across Russian borders.
International migration statistics tend to be especially misleading and inaccurate—not just for Russia, but for most other modern urbanized societies. The trouble is not just illegal or unauthorized migration, which by definition is not tracked by the governments in question. Another problem is that governments always tend to pay more attention to enumerating incoming migrants than to exiting migrants: an asymmetry concerning flows that results in major uncertainties concerning stocks. The margins of error in official international migration statistics may vary considerably from one country to another, and within any given country over time.
There have been academic efforts to harmonize and reconcile official data on international migration flows. One especially worthy of mention is the effort on estimating global migration flows sponsored by the Wittgenstein Centre in Austria, whose research team has not only estimated bilateral migration flows between 196 countries for the 1990–2010 period, but also developed innovative approaches to visualizing them. (see Figures 7–9)
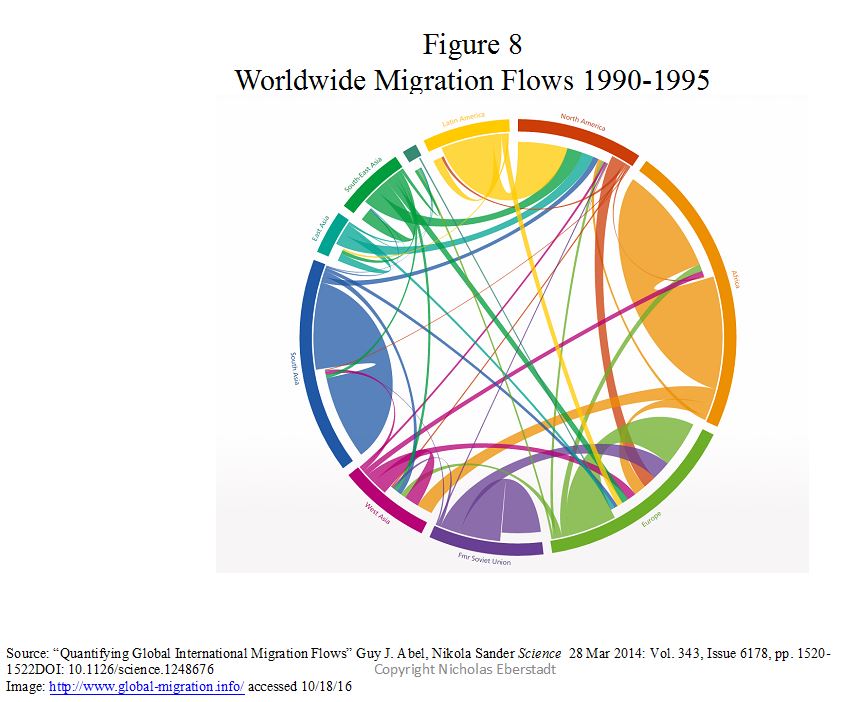

Their bottom line estimate: the Russian Federation absorbed a net influx of just under 7 million (6.84 million) persons over the course of these two decades, with the overwhelming majority of the inflow accruing from other former Soviet states.
This estimate broadly tracks with the basic demographic arithmetic concerning the Russian Federation’s population decline already noted above (i.e., an absolute estimated drop in population of about 6 million in the face of a net surfeit of deaths over births of about 13 million, albeit for somewhat different dates than the neat 1990–2010 period in Figures 7–9). The Wittgenstein Centre’s estimates also have problems, however. Most important among them: they appear to underestimate gross (as opposed to net) migration for the Russian Federation, perhaps severely: in their reckoning, fewer than 300,000 people left Russia for other countries over the two decades under consideration! In effect this means that the Wittgenstein Centre numbers will understate the presence of foreign born persons in Russia today—both in society as a whole and more immediately in the labor force. The UN Population Division, for example, estimates and projects that Russia was home to about 11 million foreign-born migrants in 2010, and a bit under 12 million (11.6 million) in 2015. [4] By this reckoning, Russia 2015 would have the world’s third-largest absolute stock of migrants (with Germany now just edging Russia out for second place, and the United States unrivaled for first place with its estimated almost 47 million foreign born), and they would account for a bit over 8% of Russia’s total population. Although UNPD does not provide the necessary numbers, we may assume the share of foreign-born men and women in the national workforce today would have been well above 8%. For Russia such migration is a two-edged demographic sword: while offering the opportunity of augmenting economic production and national wealth, it also conveys the risks to social cohesion incumbent in assimilating any newcomers from abroad.
Some questions about the magnitude and composition of international migration to Russia, unfortunately, cannot be answered conclusively, or at least answered with any great degree of precision. But Russia is also subject to the pull of domestic migration, and these movements can be tracked a little more closely. We can look at Russia’s changing regional population composition, as estimated by Goskomstat, using the 1989 Soviet population census as one benchmark and the (necessarily somewhat less reliable) New Year’s Day 2016 regional population estimate as the other. The intervening population shifts will of course be affected by the balance of births and deaths, but it will also be strongly shaped by population movements—especially where proportionate population change deviates most extremely from overall national averages. (see Table 1)
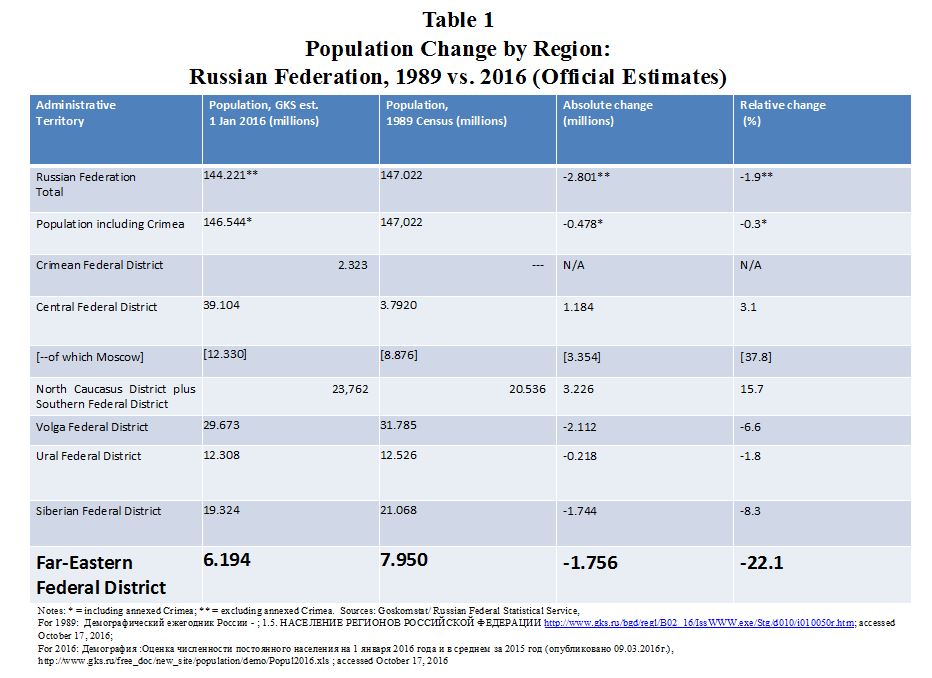
While Russia’s total population (within its pre-Crimean annexation borders) was estimated to be roughly 2% lower at the start of 2016 than in 1989, some places looked to be big “winners,” in the sense of large demographic gains, while others looked to be major “losers.” Among the former, the obvious standout is Moscow, which reportedly grew by nearly 40 percent (37.4%) over the intervening generation. (When Moscow is excluded from the Russian Federation’s Central Federal Region, population for the rest of that area dropped by about 8% over those years.) Not surprisingly, the North Caucasus and Southern Federal Districts registered population increases during this period. On the other hand, the Siberian Federal District registered an 8% population decline between 1989 and 2016, and the Far Eastern Federal District reported a stunning 22% population drop.
Given that Moscow is perennially one of the lowest fertility regions in a nation, which has itself been characterized by sub-replacement fertility over the past generation, the population surge in the capital can be explained mainly as a story driven by in-migration. Population increases in the North Caucasus and Southern Federal Districts, which include provinces aforementioned for their relatively high fertility, look to have been generated in part by natural increase, but only partly: we should not neglect the role that in-migration played here in bolstering local numbers. As for Siberia: out-migration looks to have accelerated that Federal Region’s population decline, while the Russian Far East’s virtual population collapse speaks to an immense and apparently still ongoing exodus of people from that area.
None of these population movements should surprise. Quite the contrary: in a society where people are no longer forced by police power to reside in remote, inhospitable and economically irrational locales, Russia’s post-Communist domestic migration patterns are literally a case where people are “voting with their feet.” The great movement of people southward and westward reflects choices that increase human wellbeing, and also economic welfare: old Soviet patterns of settlement were simply not sustainable absent unending subsidies and manifold instruments of police state coercion. [5]
Demographic change that improves human welfare, however, does not automatically or necessarily serve the purposes of national security. The emptying—or should we say, the further emptying—of Siberia and the Russian Far East is creating something approaching a demographic vacuum in an enormous realm immediately north of China, which for at least the time being is the world’s most populous nation, and one that is densely crowded in much of its inhabited territory. (see Figure 10)
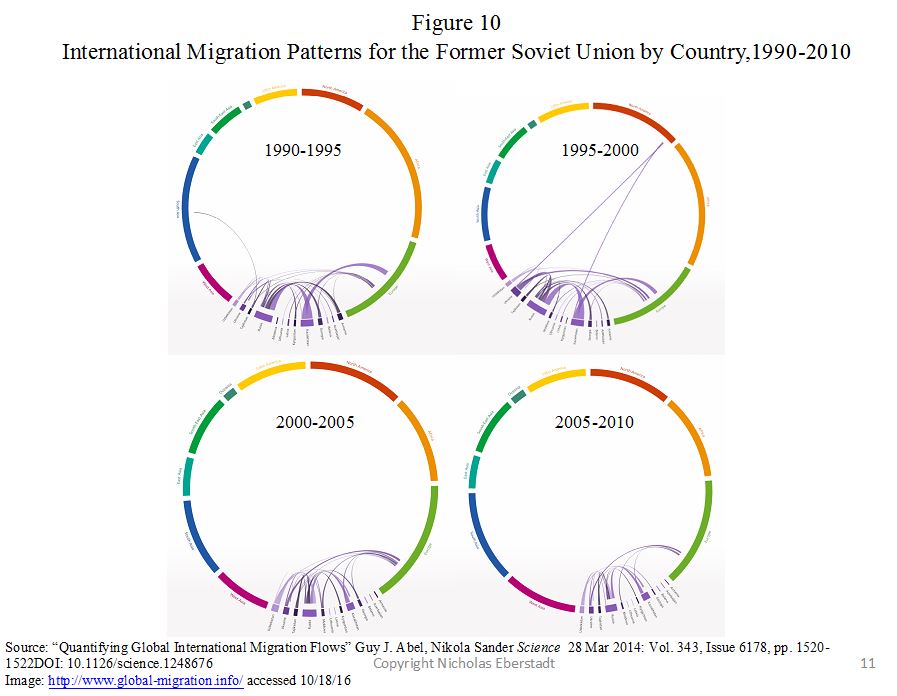
Could the Russian Far East become contested territory in years ahead—or even part of a Chinese sphere of influence? Population density maps do not provide us with anything like a sure answer to this question. The fact that Russians have been fleeing the Russian Far East in droves would hardly seem to suggest the place would be regarded as deeply alluring by prospective migrants from China. Yet, at the same time, the defensibility of this vast, increasingly empty space is not a fantastical issue to consider—nor should it be regarded as a given that Moscow will indefinitely be the government with the strongest claim on it (and the strongest means for enforcing its claim).
Russia’s Disastrous Health Profile
While the welfare implications of Russian birth patterns may be open to debate (should these be higher? should these be lower?), and while the implications of migration patterns may be auspicious from the standpoint of human welfare, Russia’s mortality patterns and the health conditions they reflect look little short of calamitous for a more-or-less modern society. Health bears directly on individual welfare—and also on economic potential for a society, which is to say that it bears indirectly on state power. Russia’s health and mortality trends are not unique—other former Soviet states like Ukraine and Belarus reflect or echo rather similar trends—but no other would-be world power is beset by patterns nearly so adverse, so anomalous, or so stubbornly resistant to amelioration.
In conceptual terms, the most straightforward indicator of mortality and health conditions is life expectancy at birth, the synthetic measure that calculates expectation of life from the survival probabilities for persons of all ages at any selected point in time. Russia’s long-term life expectancy trends are—let us put this plainly—truly dismal. We can see this in readings from the Human Mortality Database, an expert consortium that reconstructs long-term mortality trends to adjust for errors and inconsistencies in data, and thus to provide an “apples to apples” comparison between countries. (see Figure 11)
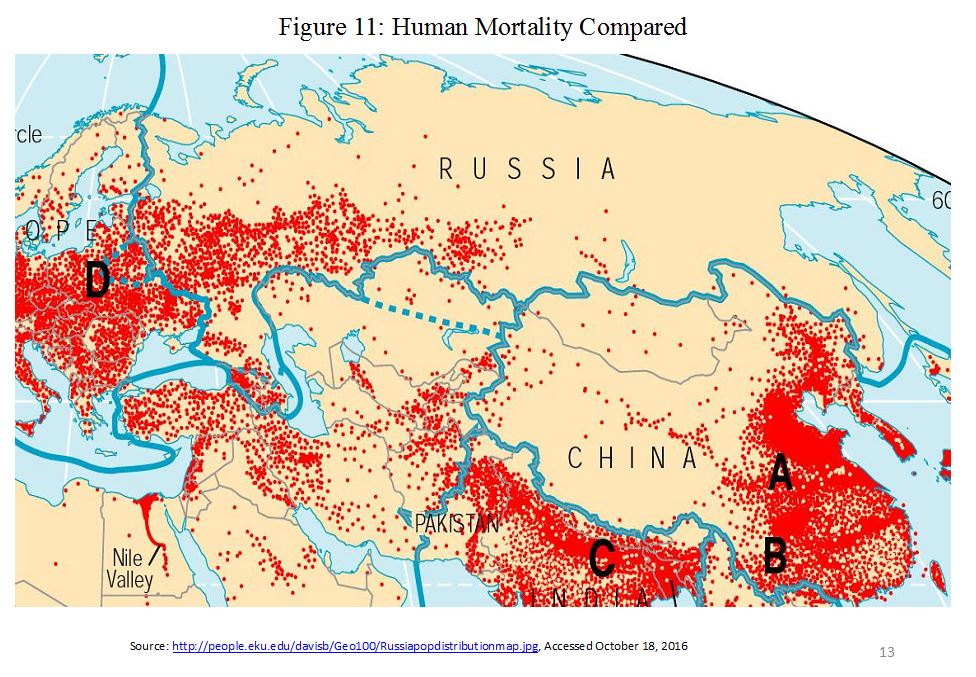
In a postwar era positively exploding with health progress, overall life expectancy in Russia has been marked by long-term stagnation and even prolonged bouts of decline. According to estimates, as late as the year 2008, overall life expectancy at birth in Russia was still slightly lower than it had been in the year 1960. As recently as 2010, male life expectancy in Russia was a bit lower than in 1960. Russian life expectancy has been on the rebound since roughly the year 2003, and it reached new heights in 2012–2014 (the most recent year for which data is available), breaking the symbolic 70-year marker for overall life expectancy at birth for the first time ever. Over the past several generations, however, Russia has repeatedly seen advances in life expectancy reversed and erased. Thus overall life expectancy for the Russian Federation in 2014 was only a bit over two years higher in 2014 than back in 1960.
If we want to be legalistic, we can make the point that Russia does in fact enjoy higher life expectancy at birth for males and females alike today (2014) than fifty years ago (1964)—although by this particular comparison both overall life expectancy and male life expectancy would be less than a year higher than half a century earlier, according to the calculations in Figure 11, and female life expectancy would be only just over a year higher. The operative point, unfortunately, is that the world is a moving target, and Russia has been falling far behind most of the rest of humanity when it comes to health improvement.
Figure 12 makes the point. (see Figure 12)
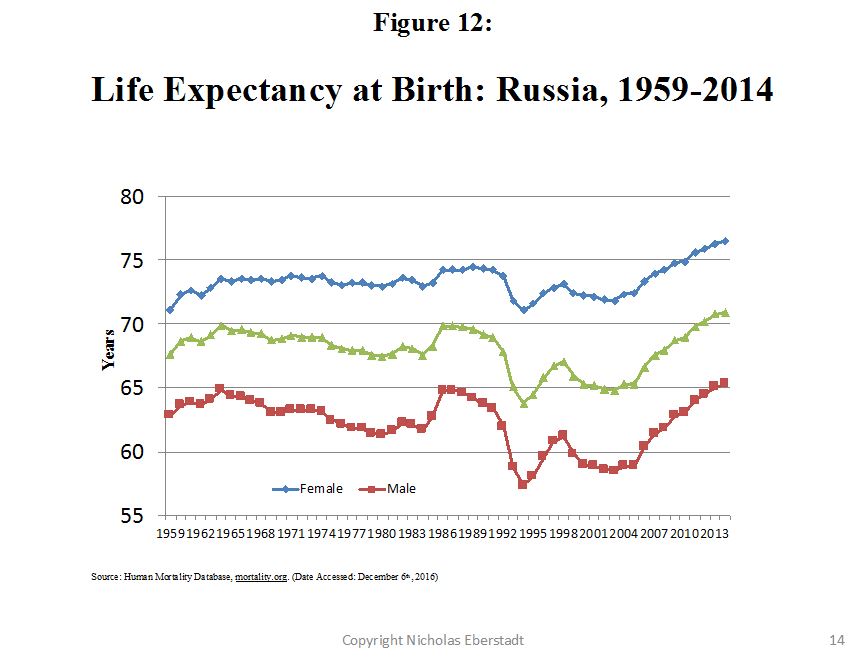
The data here are drawn from the World Health Organization-Europe’s “European Health For All Database” (HFA-DB), which estimates age-standardized death rates for all the countries in that region. (Age-standardized death rates offer another take on mortality conditions: by calculating a country’s age-specific death rates against a single “model” population structure, we can see how death rates from different places would compare if they all shared a common age-sex profile.) The HFA-DB only plots Russian trends as far as 2011, so it misses Russia’s recent achievements in mortality reduction. That said, we must note the ominous long-term divergence between Russia’s mortality trends and those for most of the rest of Europe. Between 1980 and 2011, age-standardized mortality in Russia dropped by 12%. Over those same years, within the pre-accession EU (i.e., all of Western Europe apart from Switzerland and Norway), age-standardized mortality dropped by 44%—and from a much lower starting point; consequently, by 2011 age-standardized death rates were well over twice as high in Russia as in the countries representing Western Europe.
Perhaps even more striking is the comparison between the Russian Federation and the post-accession EU states (almost all of whose populations lived in Soviet Bloc or otherwise Communist societies until the end of the Cold War). In 1989, age-standardized mortality in Russia and this grouping of countries was, according to HFA-DB, virtually identical. Twenty years later, age-standardized death rates had fallen by 27% in the new EU states, but had actually risen over the interim in Russia (by about 9%). Contrast the steady, regular annual declines in death rates reported for each grouping of EU states with the wrenching, irregular oscillations in mortality depicted in Russia. For the human beings under consideration here, the former represents something like sure and orderly progress; the latter, something more like uncertainty and misery.
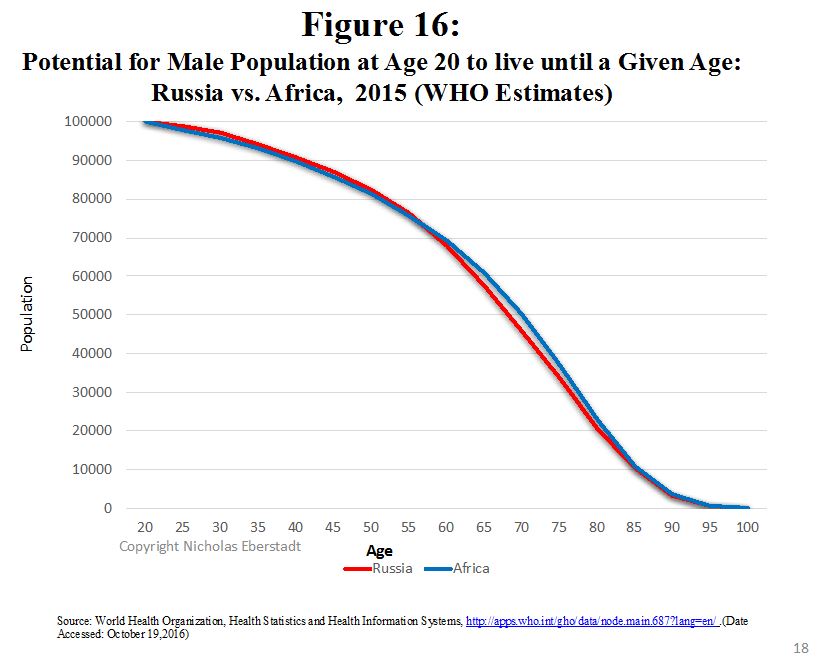
Russia’s performance with respect to adult health and mortality has been especially awful. We can see this in Figures 13 and 14, which use World Health Organization estimates for life expectancy at age 15 for the Russian Federation and the collectivity of countries the UN classifies as “least developed countries”—the world’s most impoverished societies, many of these existing under what are now called “fragile states.” (see Figures 13 and 14)


The results of the comparison should astonish—and appall. Of the 43 “least developed countries” for which WHO provides such estimates or projections, all but 12 were deemed to have higher male life expectancies at age 15 for 2015 than the Russian Federation. (To pick a few examples: Haiti’s level was said to be a year and a half higher than Russia’s—and Ethiopia’s was placed three years above Russia’s.) Russia’s women fared better than its men in this comparison—but only to a degree: at age 15, 2015 life expectancy for females was reportedly still higher in at least one “least developed” society (Comoros) than in the Russian Federation. To go by Figures 11 and 12, adult mortality levels in Russia today are not even “Third World.” Instead, they are solidly “Fourth World.” Indeed: if WHO estimates and projections are correct, survival schedules for adult men are today essentially indistinguishable between the Russian Federation and Africa—the enormity of other developmental differences between these two great expanses notwithstanding. (see Figure 15)

Unlike so many of the Least Developed Countries against which it so unfavorably compares in Figures 13 and 14, Russia today is by no means an impoverished society—and whatever else may be said about it, Putin’s Kremlin hardly resembles a “fragile state.” How then has Russia managed to “achieve” such miserable levels of mortality in a highly urbanized and literate society during peacetime? Simply stated: Russia has pioneered new and “modern” paths to premature mortality. Historically, high-mortality societies were also places ravaged by communicable disease (including endemic diseases to which poor and poorly nourished persons are more likely to succumb). Despite its looming and much-discussed HIV and drug-resistant TB threats, communicable disease today accounts for only a tiny fraction of Russia’s mortality. It is instead non-communicable diseases that kill the overwhelming majority of men and women in Russia today—and here Russia has garnered the unwanted distinction of global leader, setting grim new international records for death tallies.
In arithmetic terms, roughly 90 percent of the overall gap in age-standardized death rates between the Russian Federation and the HFA-DB’s “Western European” EU countries was attributable to differences in deaths from cardiovascular disease (or CVD—heart attack, stroke and the like) on the one hand and “external injuries and poisoning” (homicide, suicide, traffic fatalities etc.) on the other.
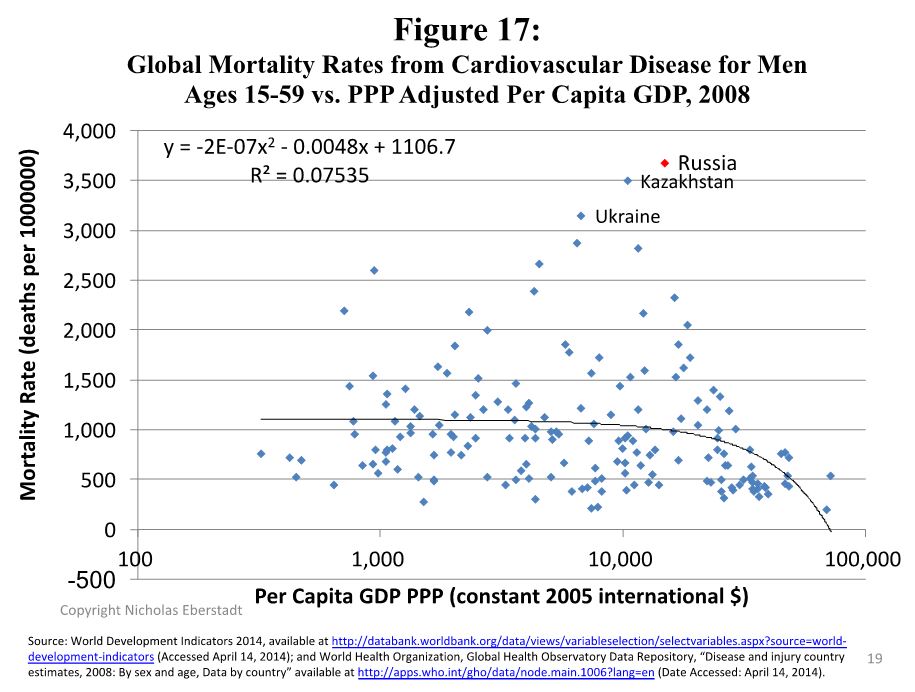
In 2011, according to HFA-DB, Russia’s age-standardized CVD mortality rate was nearly four times higher than for pre-accession EU, while its level of mortality from external injuries and poisoning was over four times as high. We can place Russian—and more particularly, male—CVD and external injury mortality in even broader global perspective using WHO estimates for the year 2008. [6] (see Figures 16 and 17)
As we see in Figure 17, Russian male CVD levels in 2008 were the world’s very highest, at least according to the WHO—and were over three-and-a-half times higher than would have been predicted for a country with the Russian Federation’s estimated income level.
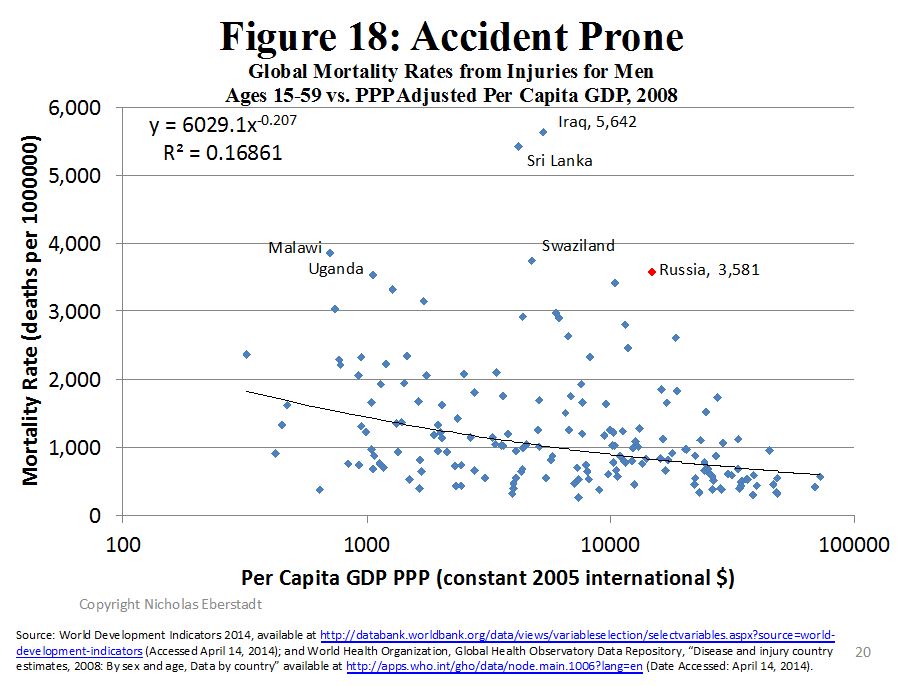
As for deaths from external injury and poisoning: Figure 18 suggests these were nearly four times as high as would have been expected in a “normal” country with Russia’s GDP per capita. Of all the societies represented in Figure 18, only Iraq and Sri Lanka—countries in the midst of insurrections and war—had markedly higher levels of death from injury and violence than Russia; if Russia’s “dot” on the chart had gone unnamed, one might easily have assumed this was a sub-Saharan “post-conflict society.” (see Figure 18)
We should be careful to emphasize that we have not directly discussed morbidity in this section—not illness, only mortality. There could, in theory, be some contrasts between trends in survival chances on the one hand and trends in disease prevalence among the living on the other. In practice, we believe trends in health are likely to mirror those in mortality fairly closely in the Russian Federation. That is to say: not only are survival prospects much worse for adults in Russia today than in Western countries, but the health conditions of those who have not yet expired are on the whole distinctly less favorable as well. This congruence has fateful implications not only for human wellbeing, but also for economic productivity—and thus the potential resources the state can draw upon in attempting to influence domestic and international events.
The Russian Paradox: High Schooling, Low Human Capital
Russia’s dreadful mortality trends look all the more gruesome when we take into account the level of educational attainment in this society. The Russian Federation has been a mass-schooling society for at least three generations: according to the Barro-Lee database on global educational attainment, as of 1950 fewer than 2% of Russians in their early twenties had never been to school. By the end of the Soviet era (1990), according to Barro-Lee, men and women in their early twenties had on average nearly 13 years of schooling—thus, reportedly, an average of one more year of education than their contemporary counterparts in Sweden. Between 1990 and 2010, mean years of schooling for young Twenty-Somethings in Russia reportedly declined: Barro-Lee estimates the drop at about a year of schooling on average. Even so, Russia remains among the countries with the very most adult schooling in the world today. As of 2010, roughly 60% of the Russian Federation population 25 or older had taken some higher education (tertiary level): this compares with just 35% for affluent and educated Switzerland.
Part of the discrepancy here is definitional: the Russian Federation educational system counts as tertiary grades that would still be regarded as secondary education in most Western countries. Nevertheless: in terms of mean years of schooling (MYS) for its adult population, Russia reportedly holds its own with Western Europe.
In 2010, according to Barro-Lee, MYS for the 15+ population in Russia was actually somewhat higher than the average for OECD countries that same year (11.5 vs. 11.2); it was more or less the same as in such places as Australia, Japan, and Norway, and nearly a year higher than in Belgium or France. (see Figure 19)

Here then is the terrible mystery of Russian education and health: how can a country with a Danish profile for MYS for those 15 and older simultaneously present with a life expectancy at age 15 males estimated to be fully five years lower than Liberia’s, and with a life expectancy at age 15 for females estimated to be only a few months above Liberia’s (as we saw in Figure 14)? According to Barro-Lee, Liberia’s 15+ MYS in 2010 was just over 4 years—in other words, barely a third of Russia’s.
On its face, such an outcome would seem to fly in the face of more or less everything social science, epidemiology, and public health seemed to establish about the relationship between education and mortality over the past century of research on this topic. All around the word, within societies and among societies, educational attainment and mortality levels are negatively associated—and that association is a robust one, for children and adults alike. [7] (Indeed, education appears to be a more important factor than income in mortality reductions.) Russia today would appear to constitute a dismaying but all too genuine exception to these worldwide findings.
We might say that Russia presents us with a “high schooling/low human capital” paradox: somehow, and seemingly despite all odds, contemporary Russia has managed to keep on mimicking the mortality levels of societies where mass illiteracy is still endemic. (see Figure 20)

And the paradox is not limited to health results: despite its apparently high level of educational attainment—or at least, its population’s considerable exposure to Russian schooling—post-Communist Russia’s performance in what we might call “knowledge production,” and in knowledge- or skill-intensive international service markets, is absolutely miserable as well.
“Knowledge production” is admittedly a difficult quantity to measure in precise figures—but as a first approximation, patent awards might be a serviceable beginning. In Figure 20 we see how Russia has fared with awards from the US Patent and Trade Office (USPTO) over the first decade and a half of the 21st century. (see Figure 21)
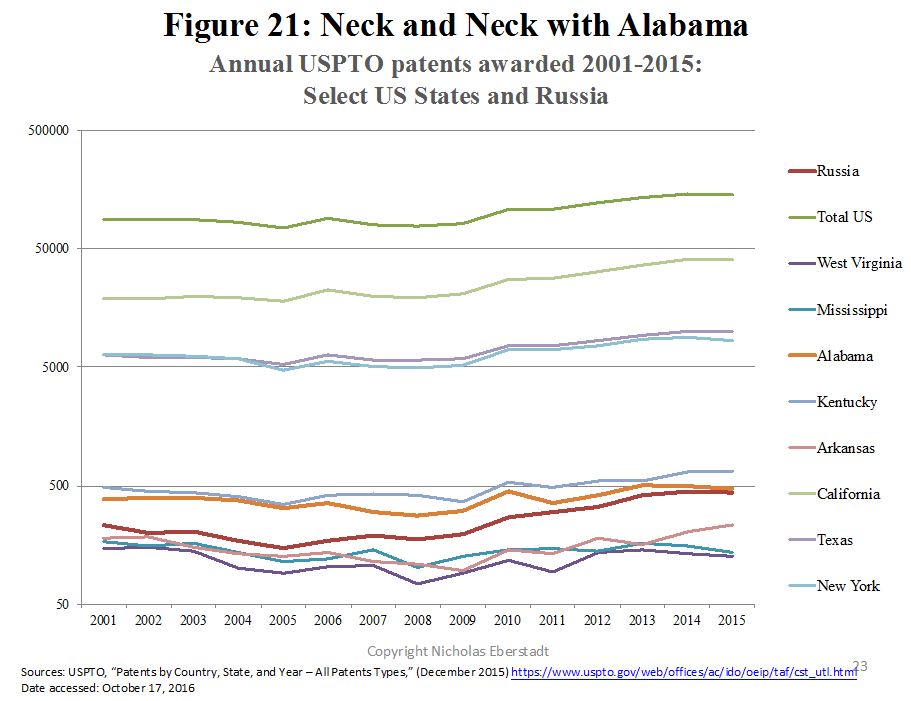
The entire Russian Federation did not earn as many patents as the US state of Alabama between 2001 and 2015—and Alabama’s population is scarcely more than a thirtieth of Russia’s.
It is true that American applicants may possess a sort of local advantage against foreign competitors with regards to USPTO awards—but Russia’s performance in relation to other foreign applicants clearly comes up short as well.
For the 2002–2015 period, Russia ranked 24th among international awardees for USPTO patents—far behind tiny Finland and Denmark, and with less than 3% as many patents as Taiwan, a place with less than a sixth of Russia’s population. Russia at present accounts for roughly 2% of the world’s total population, and over 3% of the world’s working age population with higher education, but for barely 0.2% of the US PTO’s international awards.
Russia’s breathtaking underperformance in US “patent yields” is not a due to some structural particularity of the US legal or administrative apparatus, much less to some special anti-Russian animus in American patent award decisions. A sadly similar picture can be drawn from international patent application data collected by the UN World Intellectual Property Organization. (see Figure 22)

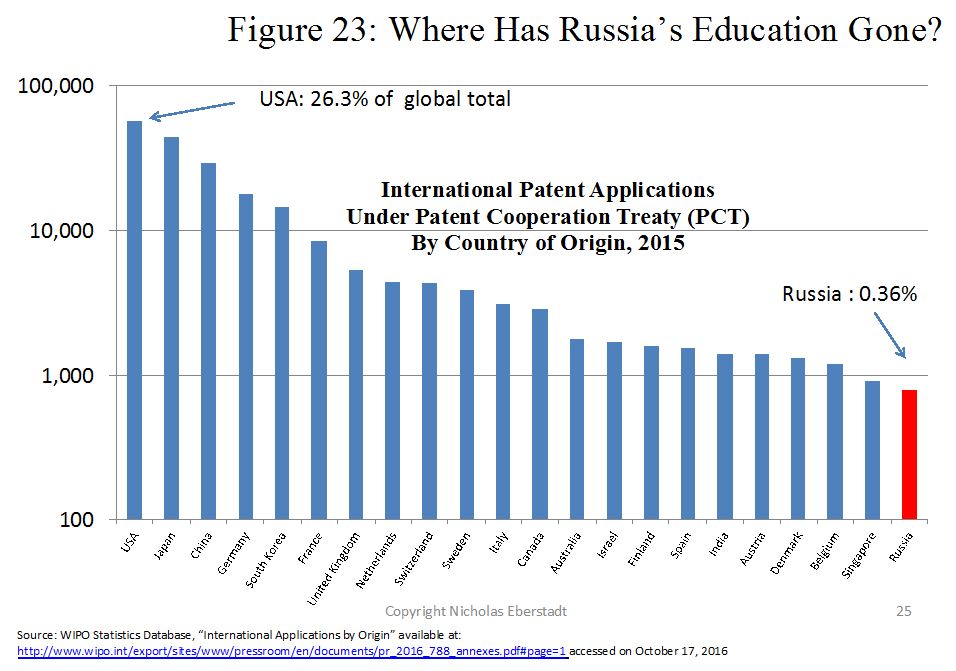
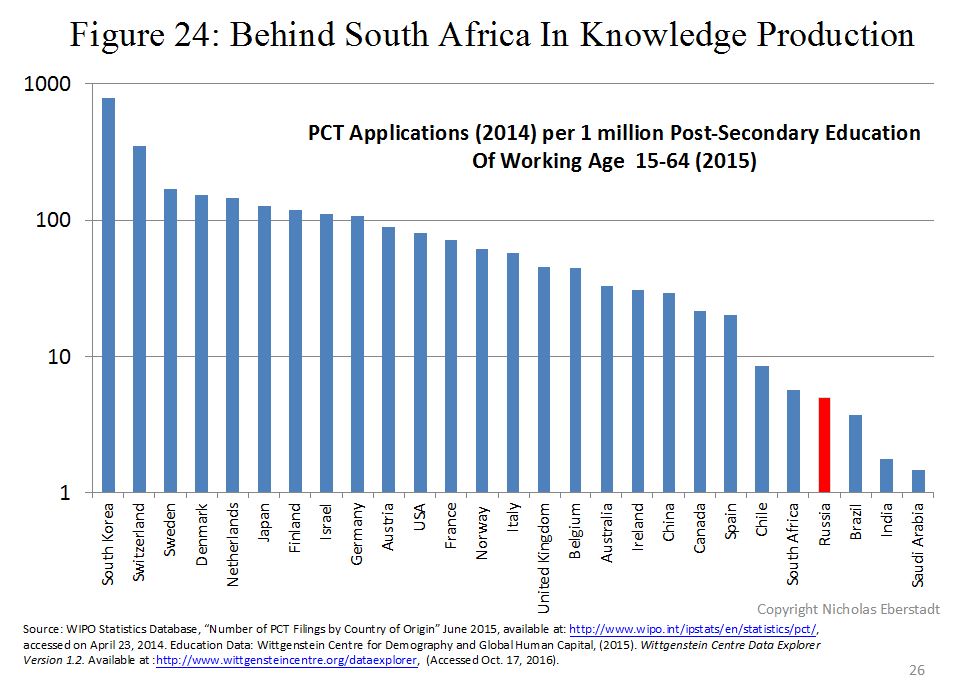
In 2015, Russia ranked 22nd worldwide in such out-of-country applications, the USA this time included, with half as many applications and barely a fifth as many as Sweden. Fewer than 0.4% of WIPO-tracked international patent applications in 2015 came from the Russian Federation—that is to say, almost an order of magnitude less than Russia’s global proportion of the tertiary working age population. We can also examine international applications per million tertiary educated people of working age—and if we examine this metric, we find that Russia’s performance in 2015 was slightly below that of South Africa. (see Figures 23)
These disproportions track with similar disproportions in Russia’s performance in the world service export economy. (see Figures 24 and 25)

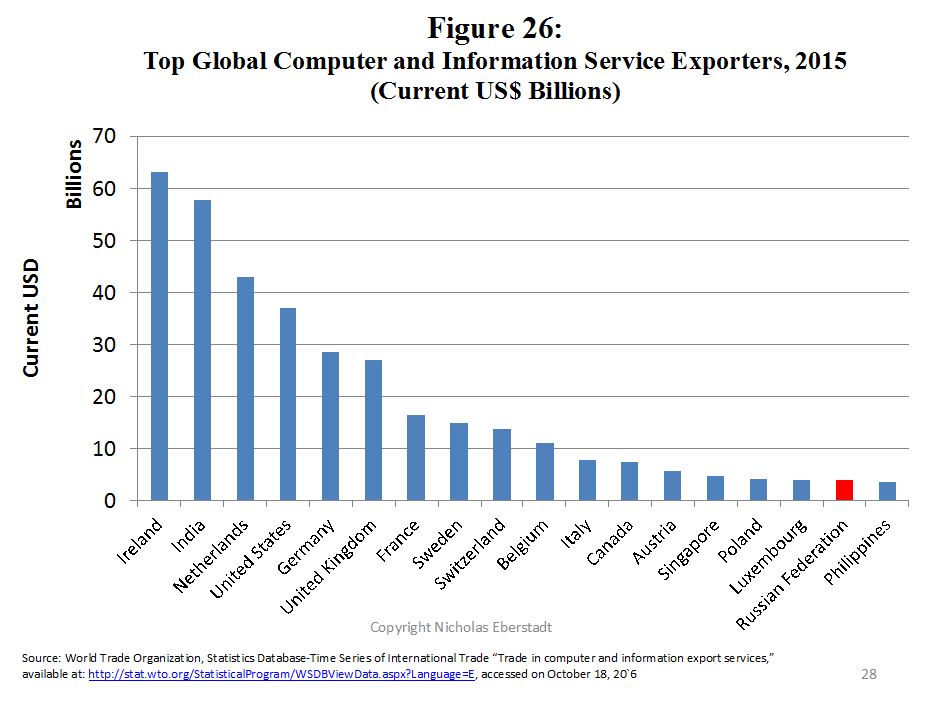
In 2015, by the estimate of the World Trade Organization (WTO), Russia did not even rank in the top 20 for total service exports. Russia’s share of world service exports that year was barely 1%. In computer and information service exports—an area one might have expected Russia to fare well in—the Russian Federation earned less than a tenth as much as India, and trailed such countries as Poland, only just surpassing the Philippines. (see Figure 26)
There may be institutional and policy factors that would help to explain Russia’s exceedingly poor performance in the international patent markets and international service export markets. Russia, after all, is full of highly educated and highly talented people. But the country’s manifest failure to meet the international market test in knowledge production and in competition for human skill-and knowledge-intensive industries is of an eerie sameness with Russia’s woeful mismatch between its educational level and its mortality level, and suggests that, for whatever reasons, education is not translating into human capital in the same manner that it does in most of the rest of the world. And since these patterns are long standing, they also look like anomalies that cannot suddenly and rapidly be mitigated. Needless to say, this curious Russian deformation—this seeming inability to translate education into either health or knowledge production—is immensely disadvantageous both to individual welfare and national economic potential, thus to state power as well.
The Demographic and Human Resource Outlook for the Russian Federation
Because of the stubborn continuity that governs demographic processes, there is a considerable amount of “momentum” in all of the unfavorable trends in the Russian Federation that we have outlined already. In absolute terms, these constrain individual welfare and the fulfilling of human potential. In relative terms, they constrain the Russian state’s ability to exert its will at home and abroad. State power can be measured in absolute terms of course, but when states are in competition or conflict with other states it is the relative bearing that may matter most. And in many respects Russia’s prospective demographic and human resource outlook over the years immediately ahead looks set to trace out a decidedly downward trajectory within the family of nations.
In this section we will examine projections as far out in the future as 2040—almost a quarter century in the future. There are, to be sure, demographic projections that extend even further: the US Census Bureau International Data Base regularly calculates figures out to the year 2050, and the UN Population Division now routinely takes these out to the year 2100. I myself, however, cannot justify using general demographic projections over a quarter of a century into the future for any serious purposes because we start to enter a realm of science fiction in projections that reach out over a generation from now. In such exercises we are obliged to makes guesses about how many babies the currently unborn are going to be having. Thus, 2040 seems to me to represent the very outward limit we may responsibly entertain at the moment for discussing the demographic outlook in Russia—with an understanding that a closer horizon (say, 15 or 20 years) might be more suitable for countries with higher fertility levels and thus with what we might see as more rapid “demographic turnover.”
An overall impression of Russia’s coming population structure is afforded by Figure 27, in which we compare the Russian Federation’s 2010 population “pyramid” with the Census Bureau’s projection for the country’s age-sex structure in 2040. (see Figure 27)
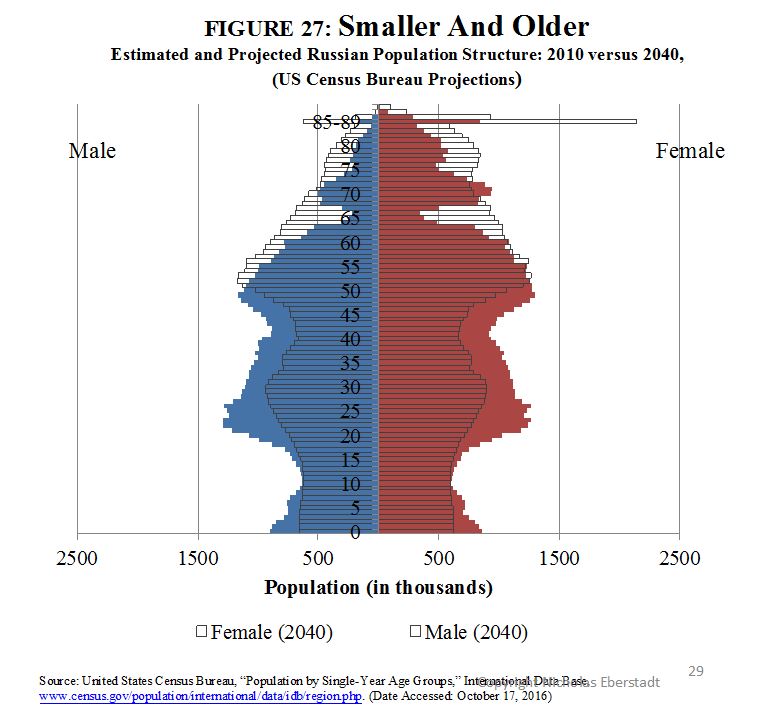
What will be immediately apparent is the envisioned Russia of 2040 would have a markedly smaller population of people under the age of 50 than did Russia 2010—while Russia 2040 appears to be on track to have a much larger 50-plus population than does Russia more or less today. Despite its grim survival schedules, Russia is an aging society—and the graying of Russia will have inescapable implications both for individual wellbeing and for the quest to augment and deploy national power.
Although Russia’s post-Communist depopulation ceased in 2009, and was slightly reversed in the following years, UN Population Division projections envision a return to depopulation for Russia over the generation ahead. (see Figure 28)

The only difference between these alternative “variants” presented by UNPD is how soon depopulation resumes—and how fast it then proceeds. With a slight increase in fertility under “medium variant” assumptions, Russia’s population falls almost ten million between 2015 and 2040; on the other hand, with “low variant” assumptions, which contemplate a drop of fertility back below 1.4 births per women, Russia’s population plummets by nearly 20 million between 2015 and 2040. Even with the “high variant” assumption of a swing to above replacement fertility, the Russian Federation’s population is still projected about one and a half million lower in 2040 than in 2015.
Note, by the way, that all of these projections assume an annual net inflow from abroad of over 800,000 migrants until 2020, and of half a million each every year from 2020 onward. Demographers have no truly reliable methods for anticipating future movements of people: unsurprisingly, since these flows are so strongly influenced by the contingencies of political decision rather than the biological regularities of birth, life and death. Even so, they can anticipate big changes with respect to migration for Russia in the generation ahead. First, barring currently unforeseeable upheavals, the foreign born will comprise a larger fraction of Russia’s population and workforce a generation from now than is the case today: begging the question of assimilability and social cohesion. Second, if the voluntary movement of people governs domestic migration over the coming generation, we can expect Moscow to become even more hypertrophied and the Russian Far East to become even more empty than they are today—possibly thereby bringing the question of the sustainability of the Russian Far East into sharper relief.
Why do demographers seem to believe there is so much pressure for a resumption of depopulation in Russia? Figure 29 helps to explain this. (see Figure 29)
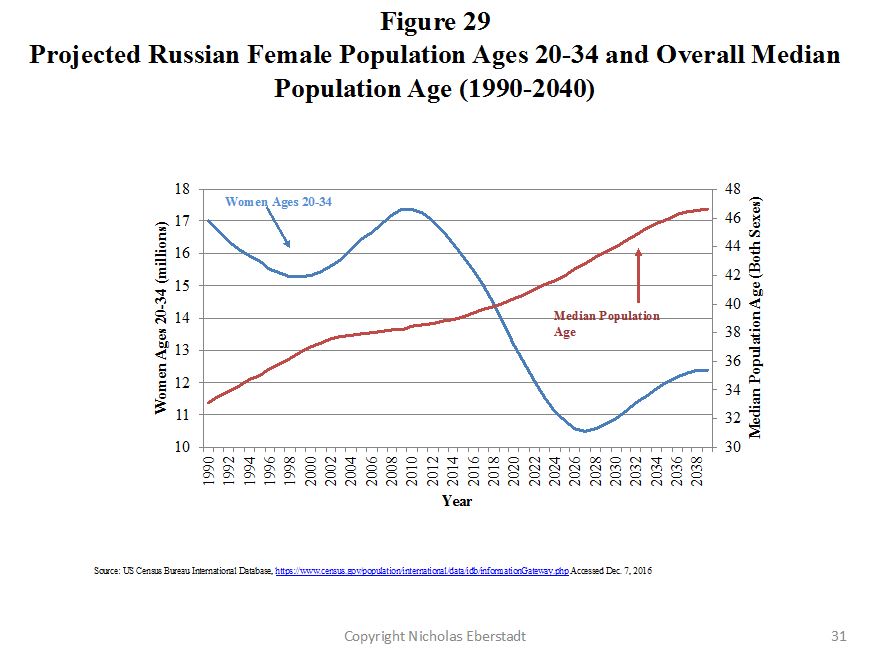
As a consequence of the pronounced birth slump of the 1990s and the 2000s, Russia’s rising cohort of prospective mothers (say, the group 20 to 34 years of age) is set to drop dramatically in the years immediately ahead: from over 17 million in 2010 to just over 13 million in 2020, and less than 11 million in 2030. It would take an extraordinary upswing in births per woman simply to maintain annual birth totals in the face of this sort of shift. At the same time, median age in Russia is steadily rising—meaning that, all other things being equal, deaths per 100 Russians will tend to increase even if health levels do not decline once again.
These pressures for fewer births and even more deaths push in the resumption of “negative natural increase,” as even Moscow’s own Goskomstat explicitly recognizes. (see Figure 30)
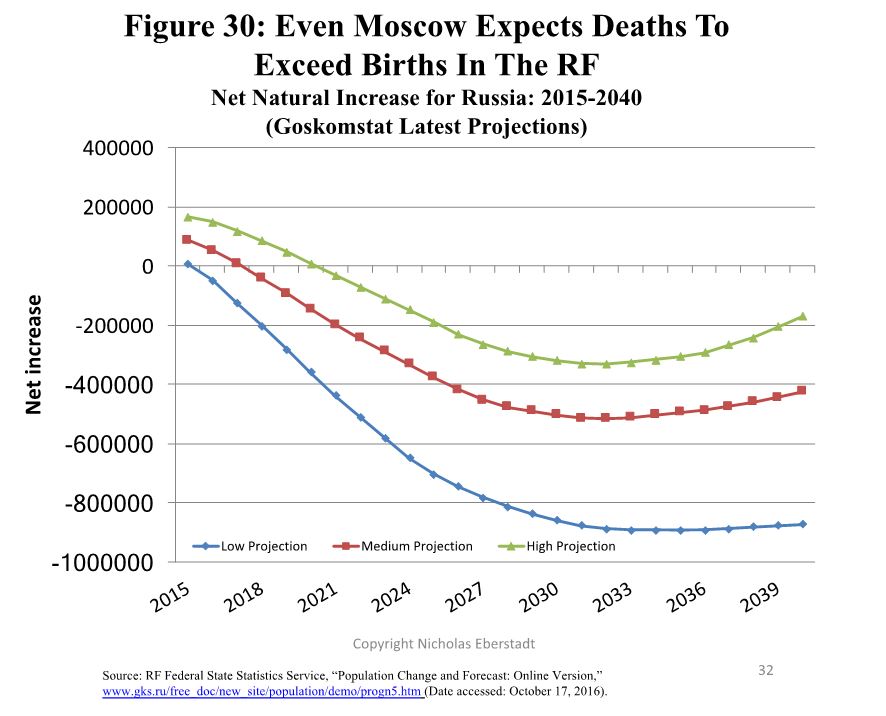
In their latest demographic projections for the Russian Federation, Goskomstat researchers depict eventual “negative natural increase” for Russia even in their “high prognosis” variant—indeed, in this “high” variant, Russia tallies over 4 million more deaths than births between 2015 and 2040. The corresponding figure is close to 9 million in the medium variant, and in the low variant the surfeit of deaths over births over this period is nearly 17 million.
Birth totals in the years ahead will have immediate implications for Russian power in a number of respects, one of the most immediate being the prospective size of its male cohorts of military age. We can take the 18-23 male cohort as a proxy for this group: obviously only a small fraction of the men in this contingent serve in the military today, and barring total war this will be true in the future as well, but the waxing and waning of this contingent casts important light on the changing availability of potential military manpower. As we look out into the future, our estimates for the size of this group will become increasingly conjectural—but all 18–23 year olds in the world of 2033 were already born by 2015 [8], and it is not until 2039 that we would be speculating about a military-age group for which none of whose members has yet been born at this writing.
As may be seen in Figure 31, Russia’s male population 18 to 23 years of age grew about a quarter between 1990 and 2007, then plunged—today (2016) it is less than three fifths its size in 2007, and fully thirty percent below its 1990 level. (see Figure 31)
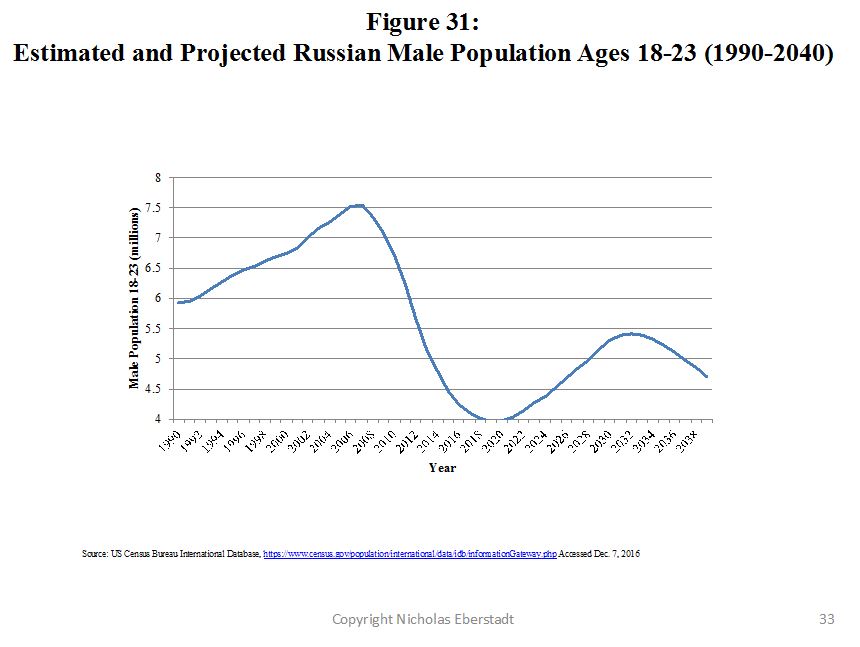
This group is set to shrink still further, until about 2020, then to grow until the early 2030s, then to begin to shrink once more. By these Census Bureau projections, Russia’s male 18-23 group would be somewhat larger in 2040 than it is today (4.7 million vs. 4.2 million), but markedly smaller than at any juncture in the 1900–2010 period.
Less conjectural than the outlook to 2040 for Russia’s male population of military age is the country’s outlook for male and female working age manpower: after all, the overwhelming majority (on the order of 90%) of those who will be 20–64 in the year 2040 are already alive, and absolutely everyone is already born who will be in the key “prime working ages” group 25 to 54 years of age.
As we can see from US Census Bureau estimates and projections, the Russian Federation’s post-Communist 20–64 population peaked around 2010, at about 95 million, and is now declining; by these projections it is on course to decline to about 80 million, or by almost a fifth from its 2010 apogee. Post-Communist Russia’s prime working age population of 25–54 year olds reached a plateau of about 65 million around 2002, but at this writing is now set to commence a long-term decline, approaching something like 52 million under these projections around 2040: a decline of about one fifth over the period under consideration. (see Figure 32)
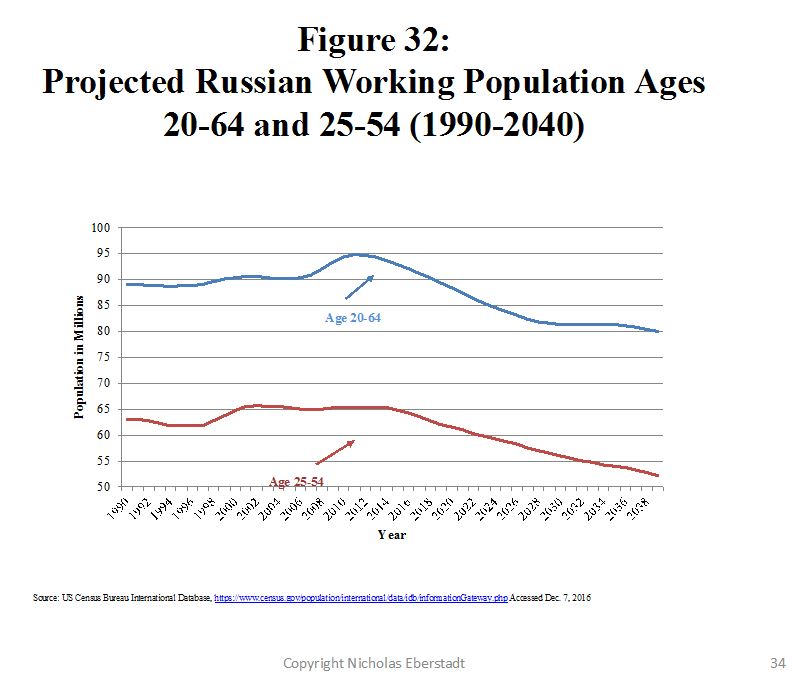
All other things being equal, these trends presage appreciable downward pressure on Russia’s economic potential. It is possible of course that workforce participation for Russia’s population of conventional working ages could rise to compensate for some of this prospective population shrinkage—but Russia’s labor force participation ratio is currently (2013 data) actually slightly higher than the average for the OECD countries, so it is not obvious there is great scope for further increments here. [9] By the same token: Russia’s employment rate nowadays (3Q 2014) for prime working age men and women is nearly 10 percentage points higher than the OECD average (85.7% vs. 76.0%) [10]—so there is only limited possibility of raising the proportion of paid workers in this key grouping much further. (Even if Russia somehow reached a 100% employment rate for its prime working age population in 2040, that would not quite compensate for the impending decline envisioned in these projections.)
Another possibility for augmenting manpower would be extending the working ages: say, out into one’s late 60s or early 70s. There has been discussion of such options in OECD countries for over a decade [11], although the proposition is not greeted with widespread enthusiasm in most Western societies. Regardless of its possible popularity, though, one may question whether this could be a remotely feasible option in Russia. Extending working ages in the West is justified under such slogans as “live longer work longer”: but as we have seen, people are not generally living longer in Russia. To judge by their mortality levels, people in their late 50s and early 60s tend already to be fairly fragile in Russia. According to the Human Mortality Database, the mortality rate for a Russian man 55 years of age in 2014 was about the same as for his 70-year-old counterpart in France that same year; mortality risks for 65-year-old Russian women were similar to those of women a decade older in Western Europe.
On current Russian survival schedules, only half of all men can expect to reach 66; in Switzerland the comparable marker would be 84. Barring a radical transformation in survival chances, there simply cannot be much hope of expanding Russia’s workforce through postponing retirement ages. And for that same reason, population aging promises to impose a vastly heavier burden on Russia’s society and economy than would a similar measure of graying on corresponding Western countries. According to Census Bureau projections, Russia’s 65+ group is on track to rise from about 14% of the total population to 22% between 2015 and 2040. This would be lower than the projected average for more developed countries in 2040 (25%). Bearing in mind the health differentials that separate Russia from most of the West, it might be pertinent to consider that the Russian Federation’s projected share of population over 60 in 2040 would be 29%—and that its 55+ cohorts would account for a projected 37% of total population that same year.
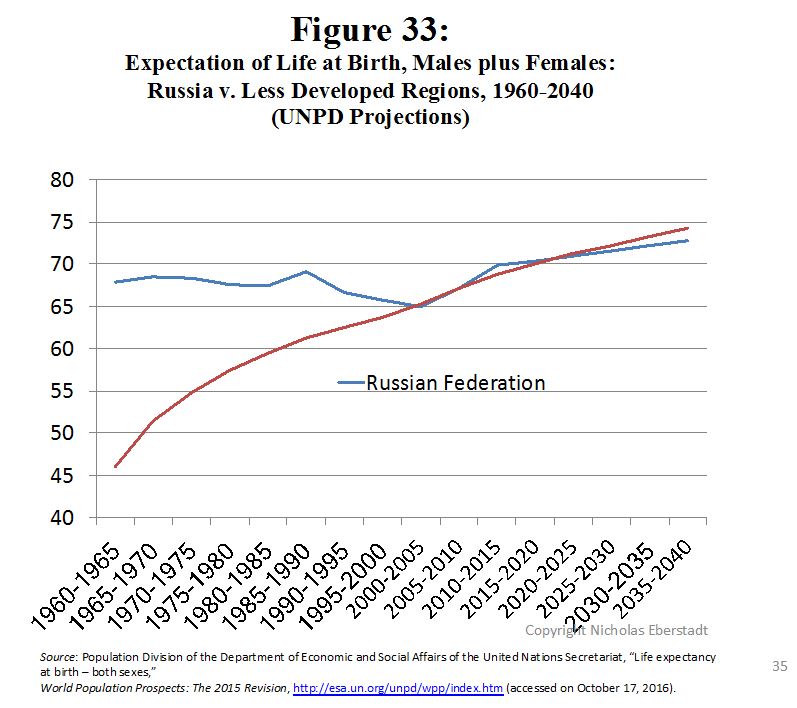
So what then of the outlook for health progress? At this juncture, the UN Population Division envisions some continuing measure of improvement in Russian life expectancy over the coming two decades—although it should be noted that this is the UNPD’s “default” assumption for all societies, and that assumption has proved badly wrong in Russia for most of the past half century. And even if the assumption is correct this time, UNPD projections nonetheless envision overall life expectancy at birth in Russia as falling slightly below that for the collectivity of developing countries in the late 2030s. (see Figure 33)
But there is reason to wonder if health improvements will be even this substantial in the Russian Federation over the decades immediately ahead—for Russia’s mortality patterns are heavily impressed with what we might describe as “negative momentum.” We can see this by contrasting Russian mortality trends for successive generations of men with Japan’s. (see Figures 34 and 35)
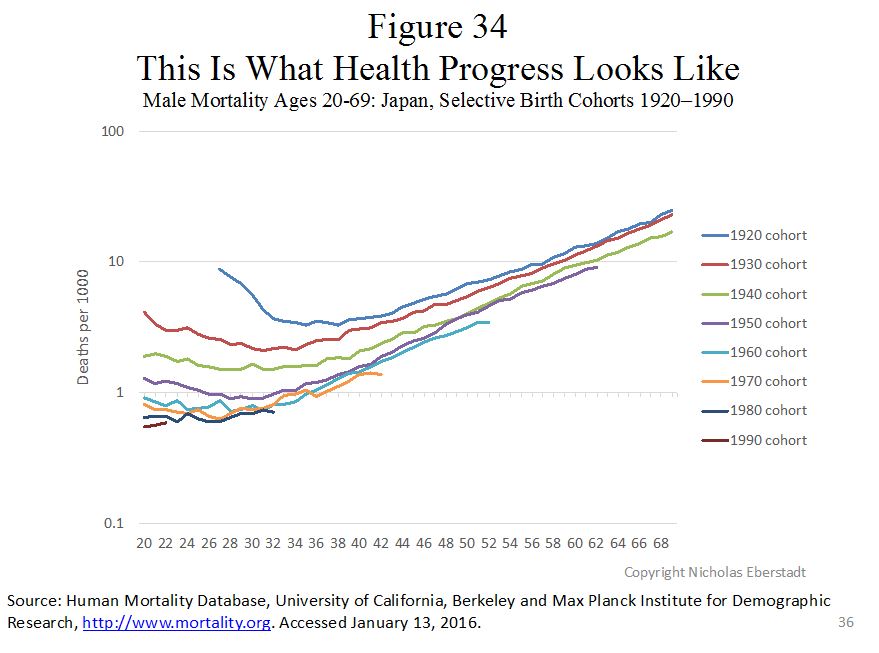
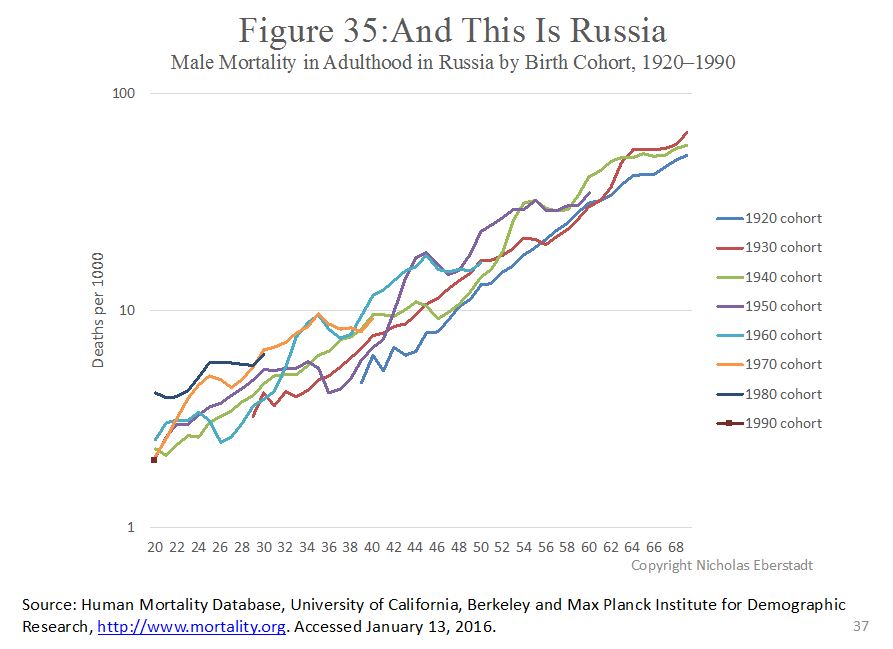
In Japan, the developed country where postwar life expectancy rose fastest and is currently highest, male death rates at any given adult age dropped steadily and often dramatically from one decade to the next—in other words, a younger brother would have a lower risk of death at (say) age 40 than did his older brother, who in turn had a lower risk than his father, who in turn had a lower risk than his own older brother. But the situation is very different in Russia. Consider mortality at age 28: in Russia the highest age-specific male mortality in Figure 35 is for the cohort born in 1980, whose level was higher than it was for those born in 1970, whose level was higher than those in 1960. A similar inversion is apparent at other calendar ages. All of which is to say that simply reverting to earlier survival schedules would be something of an achievement in and of itself for Russia’s adult male population. (The situation is less extreme for Russia’s women, but a similar problem affects them as well.) Achieving sustained health progress in Russia may prove difficult until all this “negative momentum” is redressed, and this could be a rather long-term process.
Such constraints on health improvement stand to constrain both human wellbeing and (indirectly) prospects for state power in Russia. Human resource constraints are on track to constrain Russia’s relative international influence still further, as Russia’s share of the world’s educated manpower declines over the generation ahead. Russia’s share of global population, of course, has been declining for many decades, and is on track to decline still further over the coming generation. But the explosive global spread of education means that Russia’s share of relatively educated or highly educated manpower has been falling at an even more accelerated tempo—and will do so in the decades to come.
Figures 36–39 lay out the problem for the Kremlin. (see Figures 36–39)
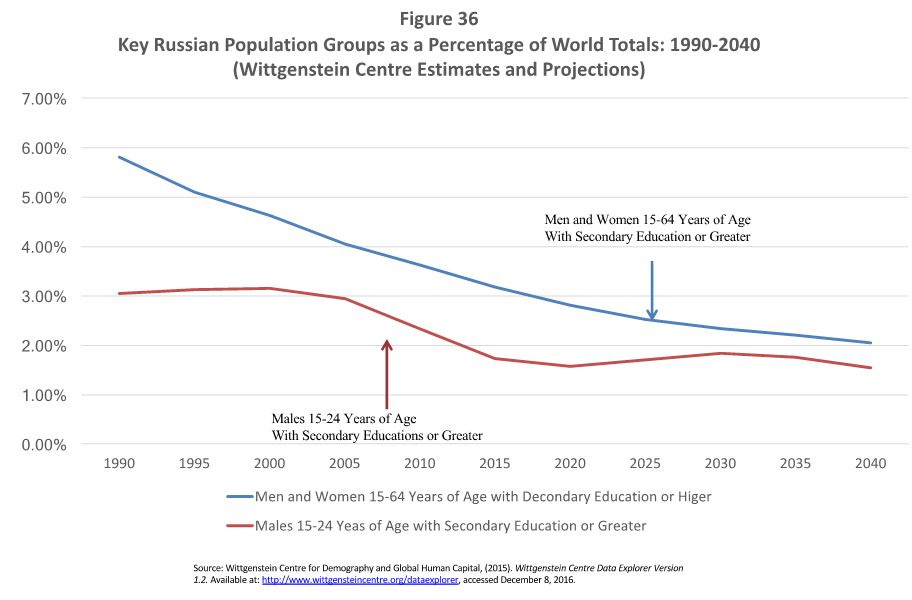

In 1990, according to the estimates of the Wittgenstein Centre in Austria (along with the Barro-Lee database, the other major source of estimates on the educational attainment of the global population) the Russia Federation accounted for almost 6% of the entire world’s working age population (15–64 years of age) with secondary education or more. By 2015 that share had dropped nearly by half—to just over 3%—and by Wittgenstein projections it would be just 2% by 2040. As Russia’s share of such relatively skilled manpower may relate in some meaningful way to the country’s international economic potential, we would expect this international potential to be on the wane now and in the decades ahead. By the same token—Russia’s share of the world’s relatively trained young male manpower is probably a better proxy for certain aspects of military potential than mere “headcount” totals alone. But Russia’s share of the world’s young men 15–24 years and with a secondary education or better has already dropped from about 3% in 1990 to about 1.7% today, and in 2040 would comprise about 1.5% under Wittgenstein “medium” projections.
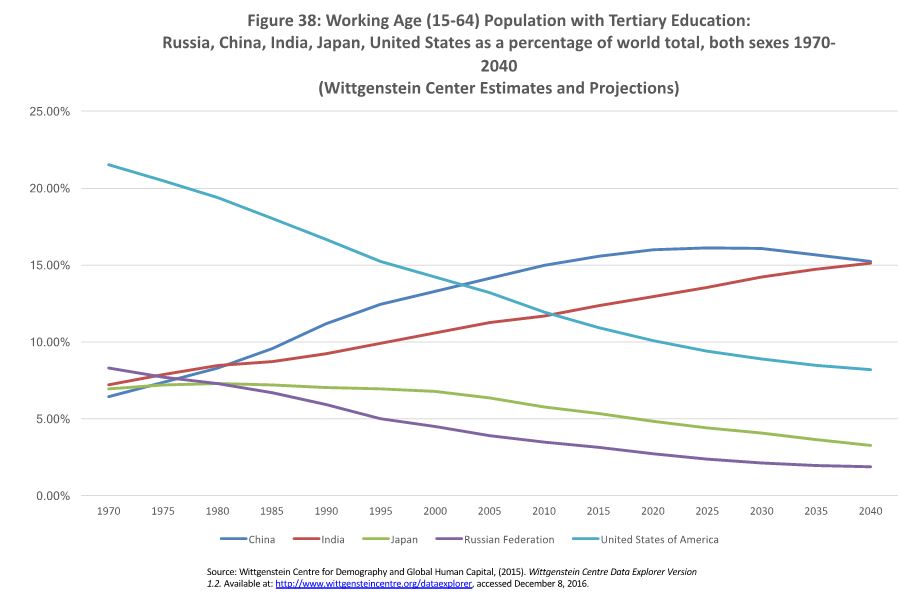
Russia’s global share of more skilled manpower—the men and women of working ages with tertiary education—has likewise fallen sharply since the end of the Cold War, with more prospective shrinkage ahead. Between 1990 and 2015, this share fell from nearly 6% to around 3%, and is on track in Wittgenstein projections to drop below 2% by 2040. All other things being equal, this would seem to augur poorly for Russia’s already weak role in international knowledge production.
Back during the Cold War, one could make the case that the USSR as a whole (and possibly even its Russian Federation subcomponent) qualified as a sort of higher education superpower. In 1970, by Wittgenstein Centre estimates, what is now the Russian Federation would have counted by itself as the world’s second greatest repository of working age men and women with higher education, trailing only the United States. By 1990, however, the current Russian Federation had already fallen to fifth place globally, dropping behind not only China and India, but interestingly enough also Japan. Despite Japan’s own recent demographic challenges, which include a decline in the conventionally defined working age population, steep population aging, and incipient depopulation, by 2015 Japan’s share of working age manpower with higher education was substantially greater than Russia’s (5% vs. 3%), and by Wittgenstein Centre projections is set to be about twice as great as Russia’s in 2040, even though both were in relative decline.
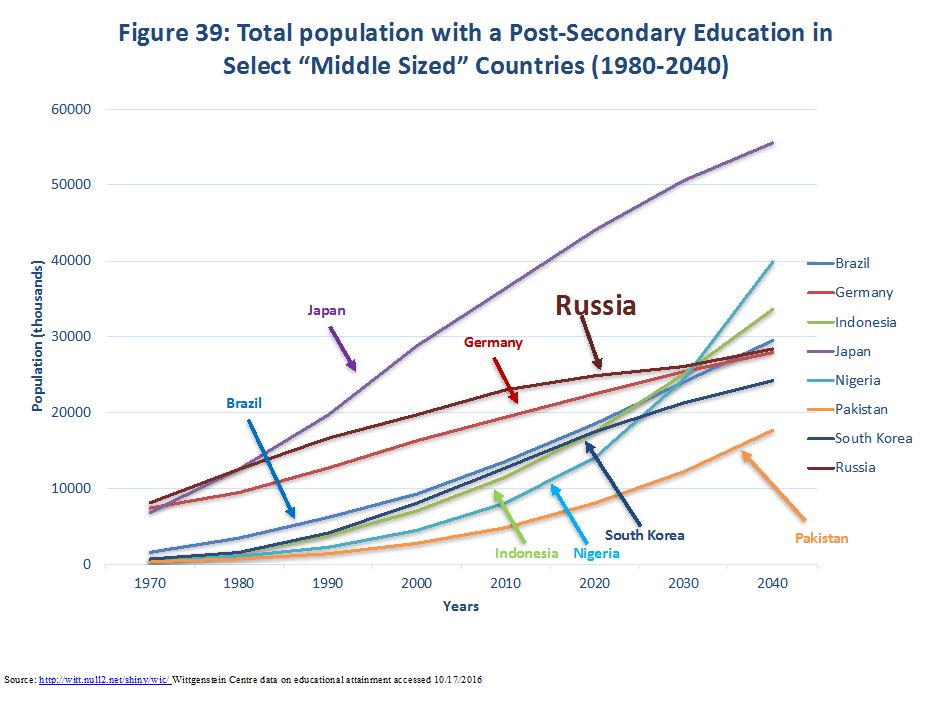
By Wittgenstein Center projections, by 2040 Russia’s share of global working age manpower with higher education would be barely a fifth of the United States’—an even lower share than today. It would be only one eighth the share of either China or India. By the criterion of trained manpower, Russia 2040 would be no more than a “middle sized country.” But according to Wittgenstein Centre Projections, by 2040 there would be a number of other such countries whose trained manpower pool would exceed Russia’s, depressing the Russian Federation’s global ranking still further below its current level. By Wittgentstein medium projections, Russia 2040 would have fallen behind Nigeria, Indonesia, and even Brazil, and would be tied for a global ninth place with Germany—this despite Germany’s own presumed continuing depopulation, and a projected total population in 2040 just three fifths as large as Russia’s.
In conclusion: our review of the demographic and human resource outlook for the Russian Federation suggests that a whole confluence of factors promise to make the improvement of human wellbeing more complicated and halting than may be the case in a great many other countries—with corresponding implications for the country’s economic development. We have also identified a multiplicity of forces pressing to reduce Russia’s relative international potential, and thus its foundations for state power, over the coming generation. By their nature, demographic changes tend to unfold gradually. The same is not necessarily true of political changes in response to demographic pressures. Some types of governments may be better suited to accommodating or coping with arguably unfavorable demographic pressures than others. An autocracy such as Putin’s Kremlin, i.e. an autocracy intent on regaining a lost geopolitical pre-eminence, and willing to take increasingly risky gambles to achieve such ends, may be especially ill-suited to sustaining policy—and even polity—in the face of such pressures. In the face of broadly adverse and unrelenting demographic and human resource trends, the possibility of some sudden political dislocation in Russia—even one or more major dislocations—should not be ruled out in the decades immediately ahead.
* * *
Nicholas Eberstadt holds the Henry Wendt Chair in Political Economy at the American Enterprise Institute (AEI), where he researches and writes extensively on demographics and economic development generally, and more specifically on international security in the Korean peninsula and Asia. Domestically, he focuses on poverty and social well-being. Dr. Eberstadt is also a senior adviser to the National Bureau of Asian Research (NBR). His many books and monographs include “Poverty in China” (IDI, 1979); “The Tyranny of Numbers” (AEI Press, 1995); “The End of North Korea” (AEI Press, 1999); “The Poverty of the Poverty Rate” (AEI Press, 2008); and “Russia’s Peacetime Demographic Crisis” (NBR, 2010). His latest book is “Men Without Work: America’s Invisible Crisis” (Templeton Press, 2016). He has offered invited testimony before Congress on numerous occasions and has served as consultant or adviser for a variety of units within the US government. His appearances on radio and television range from NPR to CNN’s “The Situation Room with Wolf Blitzer.” In 2012, Dr. Eberstadt was awarded the prestigious Bradley Prize.
Notes
- On December 1, 2015, President Putin announced to the Federal Assembly that the Russian Federation total fertility rate in 2015 would rise to 1.78, up from 1.7 in 2013. See “Presidential Address to the Federal Assembly” available electronically at https://en.kremlin.ru/events/president/news/53379. Despite such a reported increase in fertility, Russia’s NRR would still be more than 15% below the replacement rate.
- UN Population Division, World Population Prospects 2015, available electronically at https://esa.un.org/unpd/wpp/DataQuery/, accessed December 4, 2016.
- Originally proposed in 1986 by two Flemish demographers: Lesthaeghe, R., and D. Van de Kaa. “Twee Demografische Transities?” (“Two Demographic Transitions?”), in DJ Van de Kaa and R. Lesthaeghe (eds), Bevolking: Groei en Krimp (Population: Growth or Decline). Deventer, Van Loghum Slaterus. (1986).
- United Nations Population Division, “International Migrant Stock 2015”, available electronically at https://www.un.org/en/development/desa/population/migration/data/estimates2/estimates15.shtml.
- For a wonderful exposition on the economic illogic of Soviet regional planning and the distorted economic geography of the USSR, see Clifford G. Gaddy and Fiona Hill, The Siberian Curse: How Communist Planners Left Russia Out In The Cold, (Washington DC: Brookings Institution, 203), available electronically at https://books.google.com/books/about/The_Siberian_Curse.html?id=MtmQM_fDrsEC&source=kp_cover&hl=en.
- A cautionary note: these charts are intended to shock, and we have chosen these data somewhat selectively to do so; CVD and external injury levels are much worse for males than females in Russia, and male mortality levels for these causes of death have declined considerably since 2008, although they remain distressingly high nonetheless.
- There is a small library of work in this area: but to represent all of it, two citations will suffice here: https://www.jstor.org/stable/23025515?seq=1#page_scan_tab_contents; https://www.ncbi.nlm.nih.gov/pubmed/20851260.
- Migration will have some impact on these totals, but if the past is prologue here, that impact would be marginal rather than major.
- https://data.oecd.org/emp/labour-force-participation-rate.htm; labor force participation rates here are calculated for the 15–64 population.
- https://data.oecd.org/emp/employment-rate-by-age-group.htm#indicator-chart.
- https://www.oecd.org/employment/livelongerworklonger.htm.